
Recommended Tools
Free interactive tools related to this article.
ROI Calculator
Estimate potential returns and payback periods for coliving.
Try it free →Operating Budget Template
Build a comprehensive operating budget for your property.
Try it free →Pricing Optimizer
Find the optimal pricing strategy for your coliving rooms.
Try it free →Vacancy Cost Calculator
Quantify the true cost of empty rooms in your property.
Try it free →Understanding Coliving Cap Rates
The capitalization rate (cap rate) measures the expected return on a coliving property investment, calculated as Net Operating Income (NOI) divided by property value. In coliving, cap rates typically range from 4-8% depending on market maturity, location, and operational risk.
European Coliving Cap Rates
London: 4.0-5.0% — The most mature European market with institutional investor activity compressing yields. Prime locations (Zone 1-2) at the lower end.
Berlin: 4.5-5.5% — Strong demand from digital nomads and young professionals. Regulatory risk (Mietendeckel) adds a premium.
Amsterdam: 4.5-5.5% — Limited supply, strong demand, but stringent housing regulations create barriers to entry.
Lisbon: 5.5-6.5% — Higher yields reflecting a less mature market with strong growth potential from digital nomads.
Barcelona: 5.0-6.0% — Tourist regulation creates complexity but demand remains strong year-round.
Asia-Pacific Coliving Cap Rates
Singapore: 3.5-4.5% — Lowest yields but highest stability and regulatory clarity.
Mumbai: 7.0-9.0% — Higher yields reflecting operational risk and market immaturity, but massive scale potential.
Bangalore: 6.5-8.5% — Strong tech talent demand driving coliving growth. Scale economics improving rapidly.
Sydney: 4.5-5.5% — Mature rental market with growing coliving acceptance. High property costs offset by premium pricing.
Americas Coliving Cap Rates
New York: 4.0-5.0% — Premium market with strong demand but regulatory complexity and high property costs.
Austin: 5.5-6.5% — Growing tech hub with favorable regulations and lower property costs.
Mexico City: 6.5-8.0% — Emerging market with strong digital nomad demand and favorable cost structures.
What Drives Cap Rate Differences?
Key factors: market maturity (more mature = lower yields), regulatory risk, property acquisition costs, operational complexity, and investor competition. Use our benchmarks dashboard for comprehensive KPI data and our ROI calculator to model specific investment scenarios.
Frequently Asked Questions
Are coliving cap rates higher or lower than traditional BTR?
Generally 50-150 basis points higher than BTR in the same market, reflecting the operational complexity and management intensity of coliving. This premium is narrowing as the sector matures.
How do I calculate NOI for a coliving property?
Total Revenue (room rent + ancillary income) minus Operating Expenses (rent/mortgage, staff, utilities, maintenance, marketing, insurance, technology). Exclude debt service and capital expenditure. Use our cash flow projector for detailed modeling.
Written by
Admin
Admin is a contributor at Everything Coliving, the leading growth platform for coliving operators worldwide. Everything Coliving has been featured in 50+ publications including Forbes, BBC, and Financial Express.
You Might Also Like
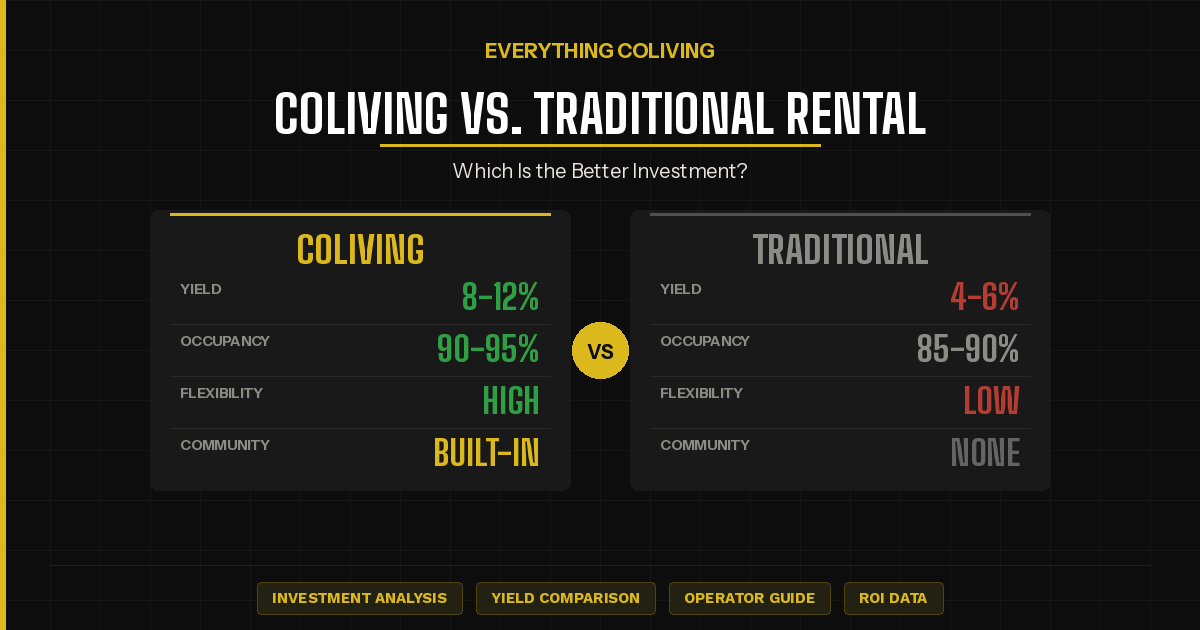
Coliving vs. Traditional Rental: Which Is the Better Investment?
Compare the financial returns, risks, and operational demands of coliving investments against traditional buy-to-let properties.
March 8, 2026
Coliving Unit Economics Cheat Sheet: CPOR, ADR, RevPAR Explained
A clear explanation of the key financial metrics every coliving operator should track: CPOR, ADR, RevPAR, NOI, EBITDA, and how to calculate and benchmark each one.
March 13, 2026

Coliving vs Build to Rent (BTR): Which Model Delivers Better Returns?
A detailed comparison of coliving and build-to-rent investment models. Yields, operational complexity, resident demographics, and market outlook analyzed side by side.
December 18, 2025